
The Partnership sends updates for the most important economic indicators each month. If you would like to opt-in to receive these updates, please click here.
Estimated Read Time: 3 minutes
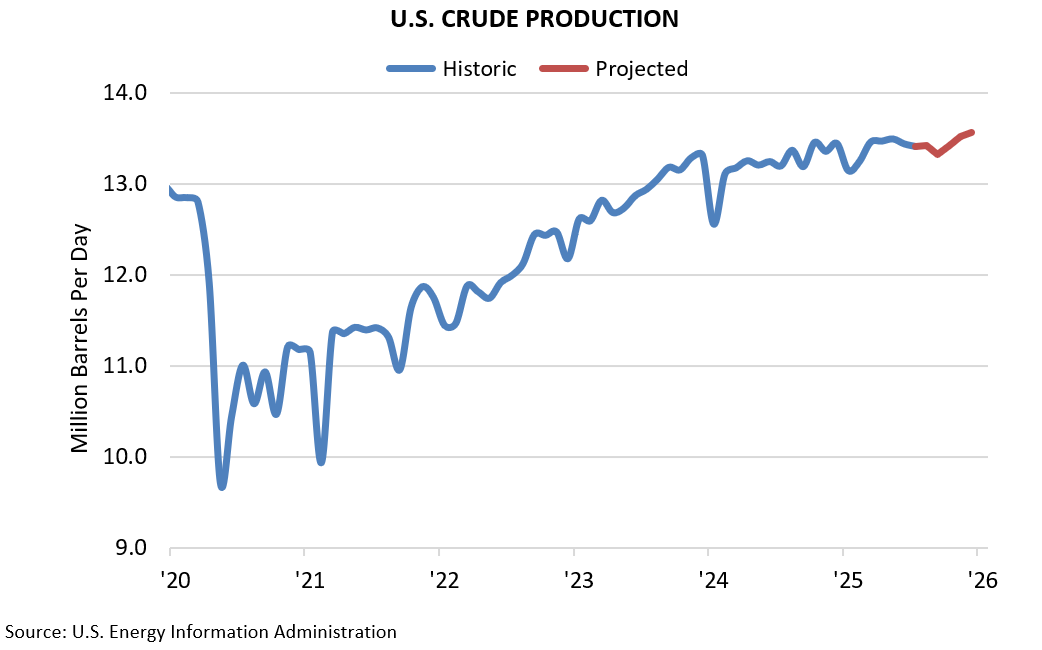
U.S. CRUDE PRODUCTION
The U.S. Energy Information Administration (EIA) projects that domestic crude oil production will hit an all-time high of 13.6 million barrels per day (b/d) in December before leveling off in ‘26. Lower crude prices have constrained production in recent months, leading to less new drilling and fewer well completions. But the EIA predicts that productivity growth in existing wells will more than offset those constraints by year’s end. On a monthly basis, production in July was virtually unchanged from June’s 13.4 million b/d.
CRUDE PRICES
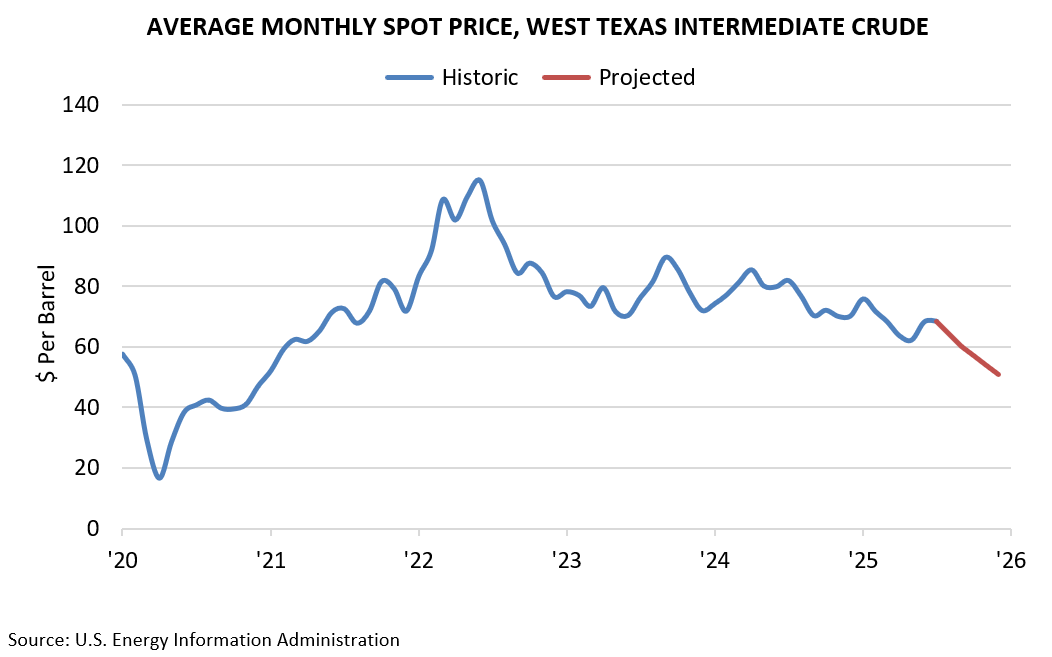
West Texas Intermediate (WTI) prices increased to an average of $68.39 per barrel in July, up from $62.17 in May. However, this upward trend is expected to be short-lived as OPEC+ members accelerate production increases and global oil inventories grow as a result. The EIA projects that crude prices will decline for the remainder of the year, with WTI falling to $51.00 per barrel in December.
NATURAL GAS
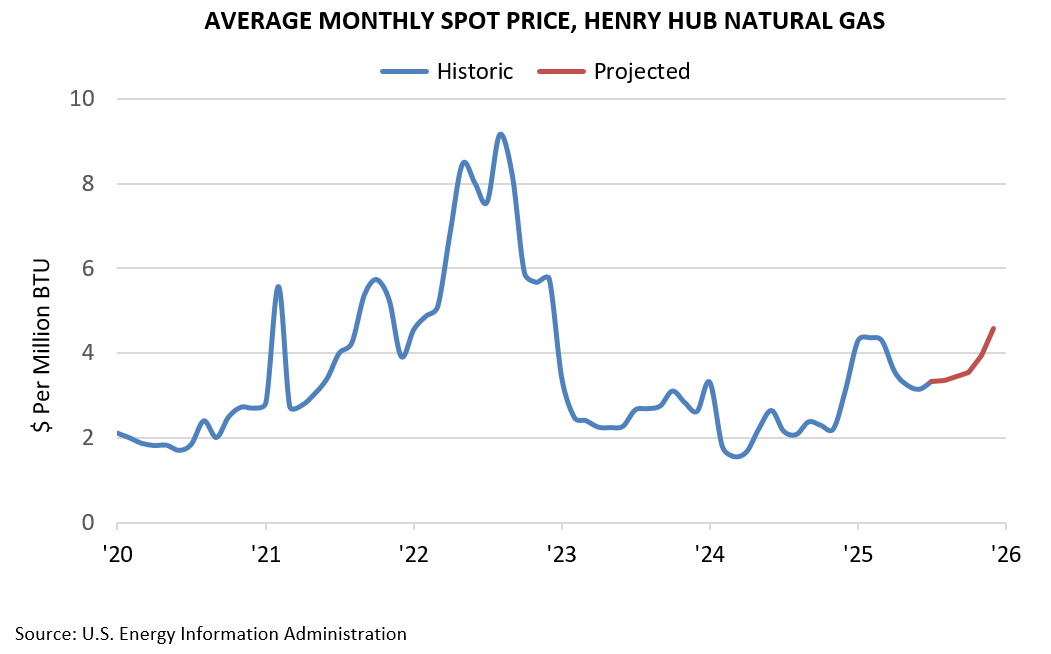
U.S. natural gas production increased to 106.7 billion cubic feet per day in July ’25 vs. 104.1 billion in July ’24. Domestic natural gas prices are down since the start of the year, with the Henry Hub price per million British Thermal Units (BTUs) falling from $4.29 in January to $3.32 in July. But prices in Europe and other international markets are higher, leading to more U.S. gas production going to LNG for export markets. The EIA projects that U.S. production will remain relatively flat while exports increase, leading the domestic Henry Hub price to grow to $4.57 by December.
Prepared by Greater Houston Partnership Research Division.
Colin Baker
Manager of Economic Research
Greater Houston Partnership
bakerc@houston.org
Clara Richardson
Research Analyst
Greater Houston Partnership
crichardson@houston.org