
The Partnership sends updates for the most important economic indicators each month. If you would like to opt-in to receive these updates, please click here.
Estimated Reading Time: 3 minutes
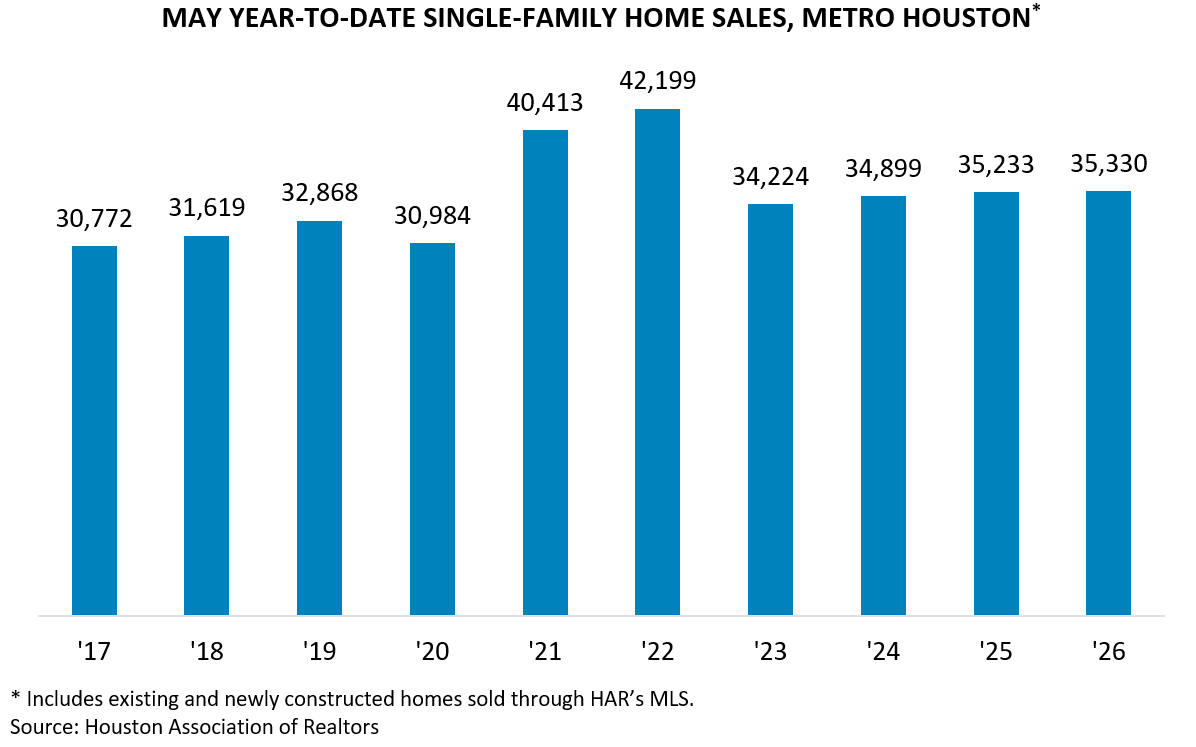
Brokers closed on 35,330 single-family homes year-to-date through May ’26, according to the Houston Association of Realtors (HAR). That is essentially flat, up just 0.3 percent from the same period in ’25. However, pending sales increased by 5.8 percent year-over-year, bringing overall monthly contract activity to its highest level since June ’22 when buyers were rushing to lock in purchases before mortgage rates climbed sharply.
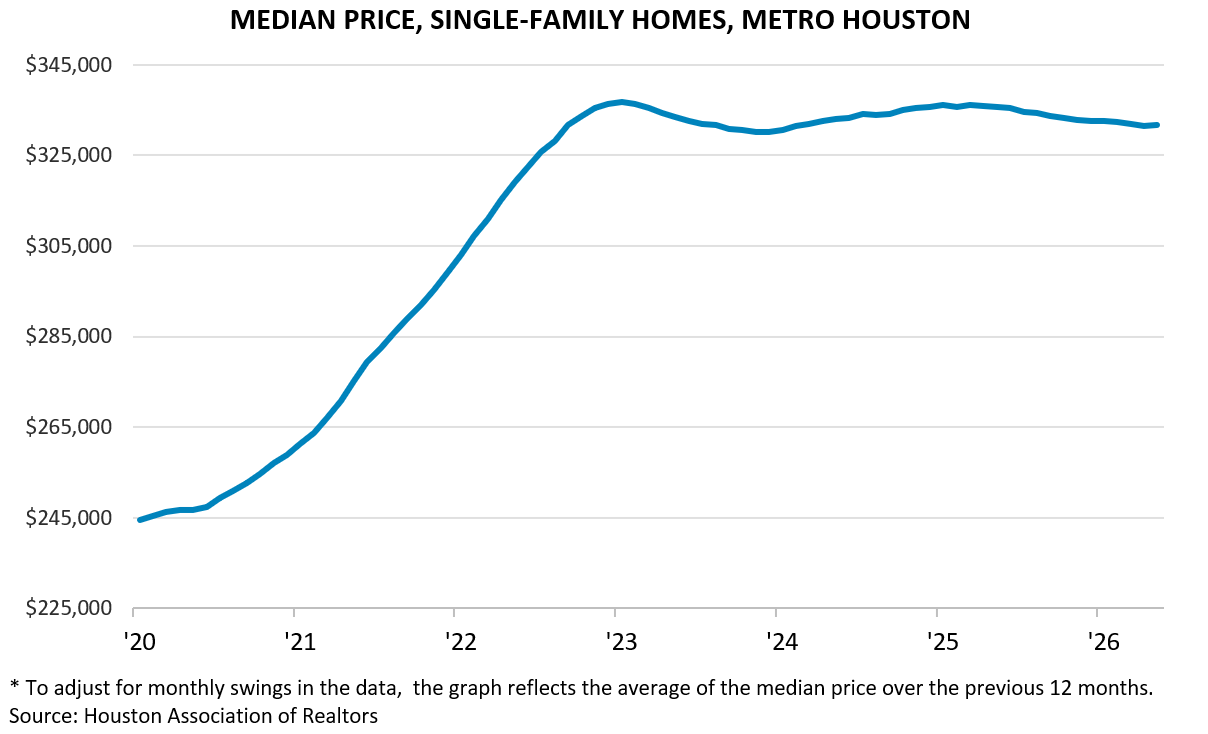
Single-family home prices tracked through HAR’s Multiple Listing Service (MLS) are up modestly over the month but still near their lowest level in two years. The 12-month average sales price for the median home sold through the MLS stood at roughly $331,692 in May ’26. That is down 1.2 percent from $335,578 in May ’25. This modest change has not meaningfully reversed the sharp gains recorded during the pandemic and its recovery.
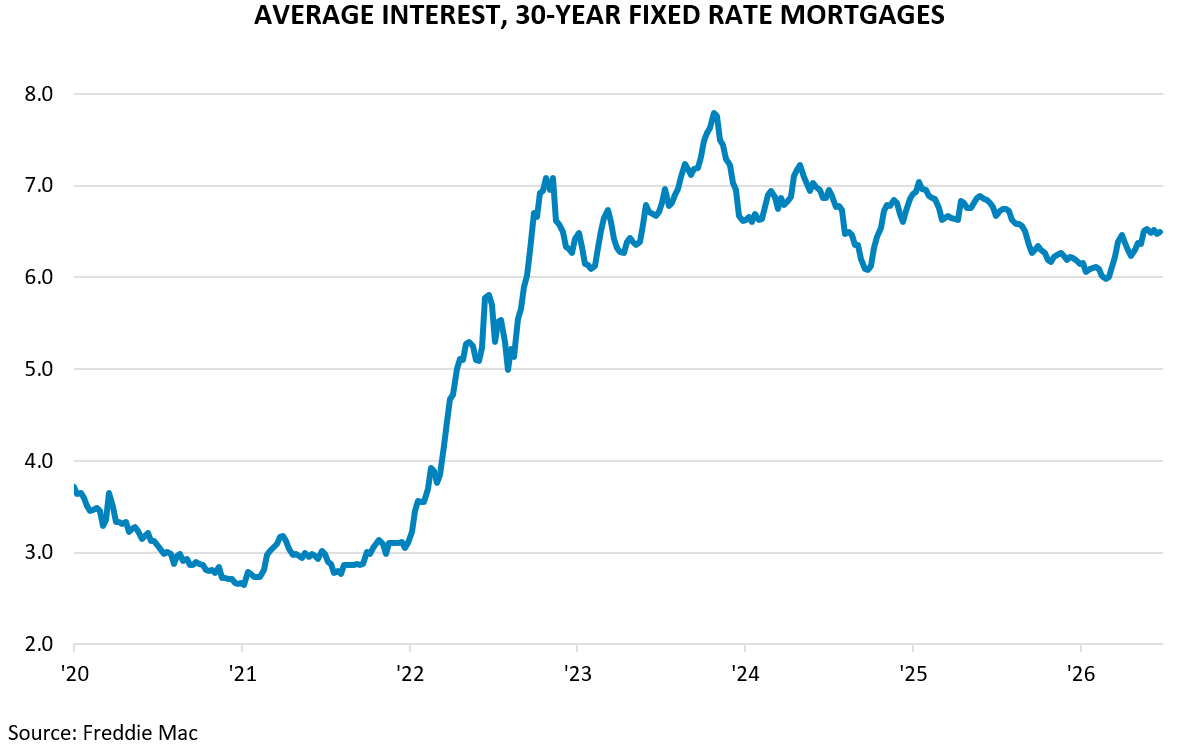
Even with home prices softening, borrowing costs remain a hurdle for some buyers. Mortgage rates have ticked up since the outbreak of conflict with Iran, as a run up in oil prices and renewed inflation fears have tempered expectations for Federal Reserve rate cuts. The average 30-year fixed mortgage rate climbed from 6.0 percent on February 26 before the conflict to 6.5 percent by June 4. The rate has remained steady in the intervening weeks, while remaining slightly below the 6.8 percent level of a year ago.
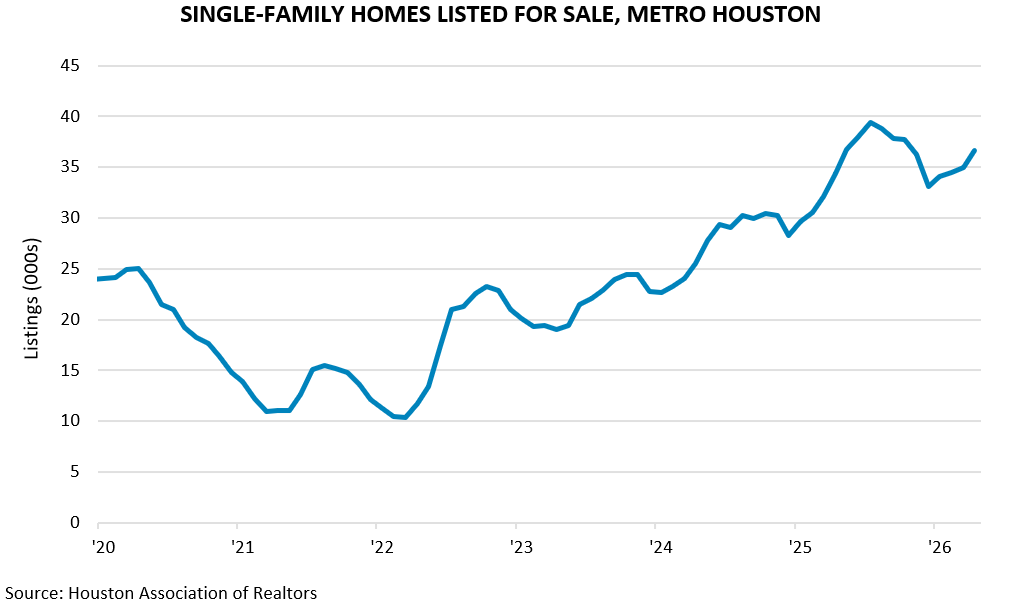
Active listings of single-family homes on the market edged up from roughly 33,000 in December to 37,000 in May. This in part reflects a typical seasonal transition from winter to the spring selling season when more listings come online. If single-family homes were to continue selling at the current rate, it would take 5.1 months to sell the available inventory of homes on the market.
Townhomes and condos are selling more slowly. Sales are down and listings are up, meaning buyers have more options and properties are taking longer to move. Yet prices are still increasing, suggesting buyers who remain in the market are gravitating toward newer, larger, better-located, or higher-quality properties.
High-rises on the other hand are a smaller, more selective market. Sales are down, but listings are down too, suggesting fewer buyers and fewer sellers are active. With only 52 sales, the higher median price likely reflects the mix of units sold rather than broad market strength.
![]()
Prepared by Greater Houston Partnership Research
Colin Baker
Manager of Economic Research
Greater Houston Partnership
bakerc@houston.org