
Data, Insight & Analysis

0
Recent Downloads

Economy at a Glance - November 2023

This issue of Houston: The Economy at a Glance examines how the economic, demographic and social characteristics of Houston’s population compares to that of other major U.S. metros.
Published on 11/9/23

A Look in the Mirror

In the October issue of Houston: The Economy at a Glance, the Partnership analyzed data from the U.S. Census Bureau’s American Community Survey (ACS) to show how the region’s economic and demographic profile has shifted over the past 10 years.

In a nutshell, Houston is older, better educated, and more ethnically diverse. One in four Houstonians was born outside the U.S., the fastest growing age group is the 65 and older population, and one in seven Houstonians moved to a different home in ’22. However, fewer Houstonians are having babies, a large portion of the population remains uninsured, one in 10 suffers from some form of disability, and many households still live in poverty. 

In this issue, the Partnership examines ACS data for the nation’s 20 most populous metro areas, exploring similarities and differences between Houston and its peers. Metro Houston includes Austin, Brazoria, Chambers, Fort Bend, Galveston, Harris, Liberty, Montgomery, and Waller Counties. 

Metro Houston has one of the youngest and most diverse populations in the U.S. The region also has one of the nation’s largest foreign-born populations. But we lag in educational attainment and health care coverage. Houston also has the highest share of residents whose income falls below the poverty line. The details follow.
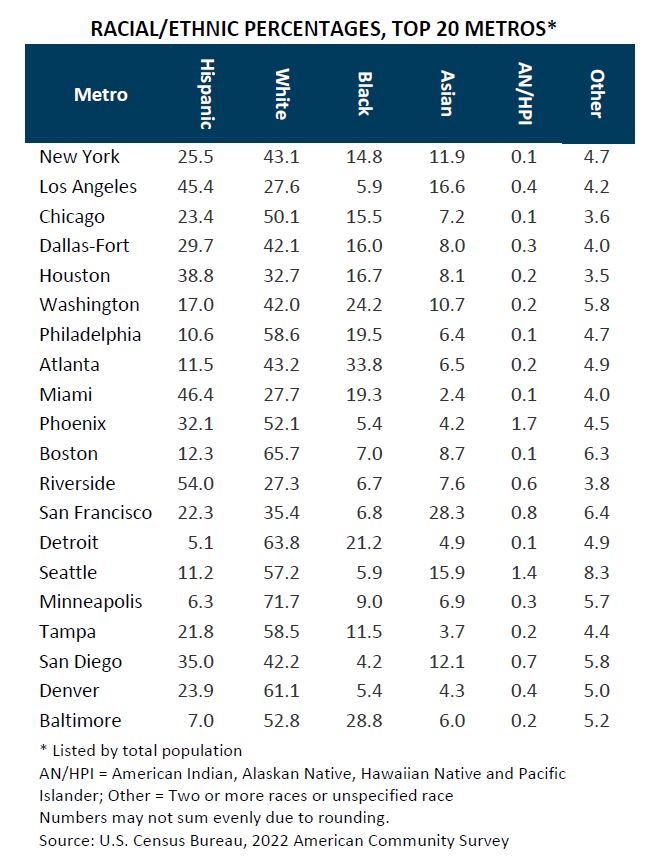
Race and Ethnicity

Houston is the nation’s most racially and ethnically diverse major metro. No individual race or ethnic group represents a majority of the region’s population. It’s been that way for over 20 years. Other metros also have large racial/ethnic populations, but they lack balance among the groups. For example, Riverside has a large Hispanic community but much smaller Black or White populations. Atlanta and Baltimore have large Black communities but few Hispanics. San Francisco has a large Asian community but relatively fewer Black or Hispanic residents. Boston and Minneapolis have large White communities but fewer Asian or Black residents.

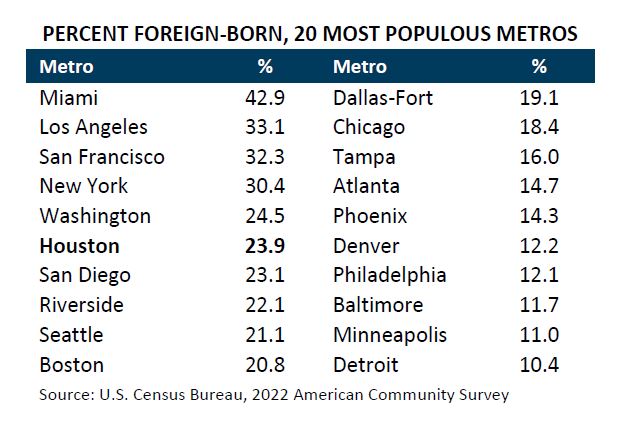
Foreign-Born Population

One in four Houstonians is foreign-born—far more than the one in seven nationally. Among the nation’s 20 most populous metros, only five others—Miami, Los Angeles, San Francisco, New York, and Washington, D.C.—have larger foreign-born populations than Houston.
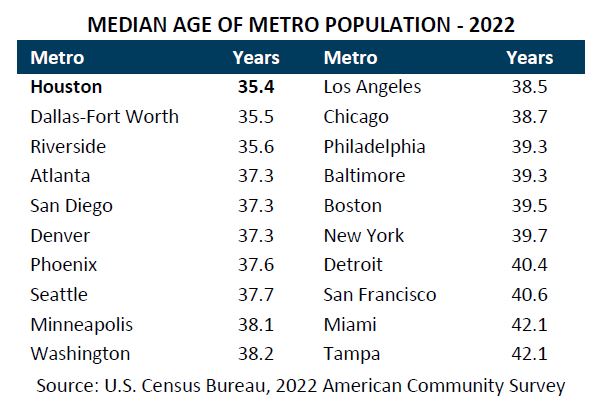
Age

Metro Houston has the youngest population among its peers. The median age in Houston is 34.6 years, which means half of all residents are younger and half are older. The median age for the nation is 38.2. 

Houston’s young population translates into a large supply of entry-level and early-career workers to meet local hiring needs, a substantial base of consumers entering their household formation and wealth-acquisition years, and a large population open to social change.

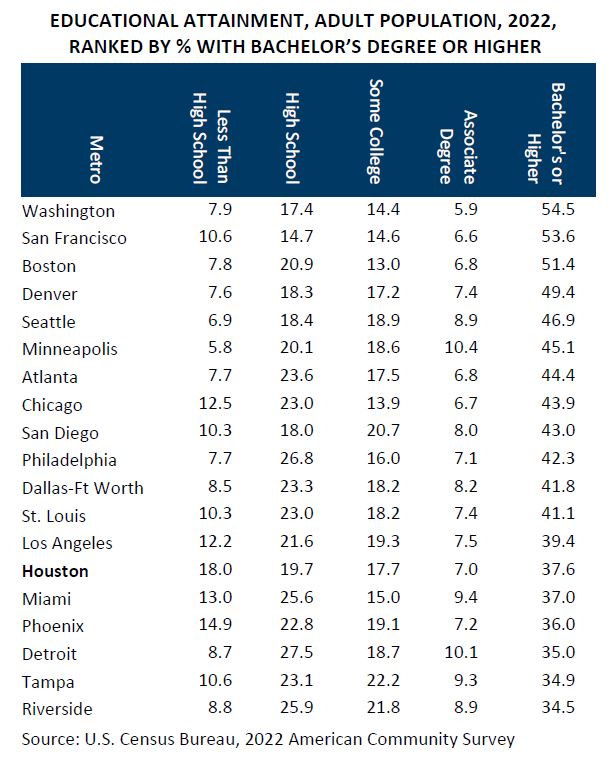
Educational Attainment

Ten years ago, 28.2 percent of adults in metro Houston held a bachelor’s degree or higher. Today, 33.1 percent do. Nationwide, 32.6 percent of the adult population holds a bachelor’s or higher degree. Though Houston has made progress, the region lags its peers. 

Houston’s lower educational attainment is a problem. When corporations consider a city for a relocation or investment, a well-educated workforce is as important as a low cost of doing business and well-developed infrastructure. Higher-skilled workers are also associated with higher levels of economic output. And Bureau of Labor Statistics research shows that the higher one’s level of educational attainment, the less likely they are to be unemployed and the higher their earning potential.

To continue reading, download this report.

Note: The geographic area referred to in this publication as “Houston,” "Houston Area” and “Metro Houston” is the nine-county Census designated metropolitan statistical area of Houston-The Woodlands-Sugar Land, TX. The nine counties are: Austin, Brazoria, Chambers, Fort Bend, Galveston, Harris, Liberty, Montgomery and Waller.

Key November Takeaways

Here are the facts to know about the Houston region this month
1
November Takeaway #1
Houston is the nation’s most racially and ethnically diverse major metro.
2
November Takeaway #2
One in four Houstonians is foreign-born—far more than the one in seven nationally.
3
November Takeaway #3
Metro Houston has the youngest population among its peers.

Want to learn more? Contact our Research Team:

Patrick Jankowski, CERP
Senior Vice President, Research
713-844-3616

Previous Issues of Economy at a Glance

OCT
2023
Shifts in Houston’s Demography
Read Report
SEPT
2023
The Houston Ship Channel, the outlook for business in Texas, and local employment trends
Read Report
AUG
2023
The Pivot from Recession to Resilience
Read Report
JUL
2023
Mid-Year Report
Read Report
JUN
2023
The Global Economy, Home Sales, and Construction
Read Report
MAY
2023
U.S. Economic Outlook and Houston's Energy Industry
Read Report
APR
2023
Houston's population growth and employment revisions
Read Report
MAR
2023
U.S. Recession and Houston's Key Indicators
Read Report
FEB
2023
The Year in Review
Read Report
JAN
2023
The U.S. Economy and Houston's GDP Estimates
Read Report
DEC
2022
Recovery in the Oil and Gas Industry
Read Report
NOV
2022
Metro Houston's Job Growth and the Apartment Market
Read Report
OCT
2022
Exploring Population Changes Through the ACS
Read Report
SEPT
2022
Recession? Maybe, Maybe Not
Read Report
AUG
2022
Houston at Mid-Year
Read Report
JUL
2022
The Houston Housing Market, Affordability, and Recent Shifts
Read Report
JUN
2022
Economic Recovery, Population Growth & Global Houston recap
Read Report
MAY
2022
Economic recovery, rising costs & labor force
Read Report
APR
2022
Population growth and employment data
Read Report
MAR
2022
Local Impact of a Global Event
Read Report
FEB
2022
Post-Analysis of 2021 Houston Economy
Read Report
JAN
2022
Omicron, GDP, Employment
Read Report
DEC
2021
2022 Employment Forecast
Read Report
NOV
2021
Job Gains, Real Estate, Exports
Read Report
OCT
2021
Inflation, Employment & Global Innovation
Read Report
SEP
2021
Employment, Oil & Gas, Containerized Exports, and Housing
Read Report
AUG
2021
Delta Variant, Rebounding Travel, Economic Growth and Population Gains
Read Report
JUL
2021
Energy Transition, Recovery Bottlenecks, & the Worker Shortage
Read Report
JUN
2021
Economic Recovery, Multifamily, Population & More
Read Report
May
2021
Housing Boom and Robust Recovery
Read Report
APR
2021
Pandemic Recovery, Tech Workforce
Read Report
MAR
2021
Pandemic Employment Data
Read Report
FEB
2021
Coronavirus Impact and 2021 Outlook
Read Report
JAN
2021
Racial Demographics and Population Shifts
Read Report
NOV
2020
U.S. Recovery, 2021 Outlook
Read Report
OCT
2020
U.S. Recovery, Houston Update
Read Report
SEP
2020
COVID-19 Impact on Economy
Read Report
AUG
2020
Energy Change Over Time
Read Report
JUL
2020
COVID-19 Update, Houston Unemployment
Read Report
JUN
2020
COVID-19 Update, Affected Sectors, Energy
Read Report
MAY
2020
U.S. & Texas Outlook, GDP
Read Report
APR
2020
COVID-19 Update, PMI, Industry Outlook
Read Report
MAR
2020
Economic Impact, Global Outlook, Recession Probability
Read Report
FEB
2020
U.S.-China Trade Deal, USMCA
Read Report
JAN
2020
Houston GDP, Energy, Jobs
Read Report
DEC
2019
Sector by Sector Forecast for 2020
Read Report
NOV
2019
Houston Region Demographic Update 2
Read Report
OCT
2019
Houston Region Demographic Update 1
Read Report
SEP
2019
Houston's Growth Engines
Read Report
AUG
2019
PMI, Commercial Real Estate & Housing
Read Report

More Insight & Analysis

Monthly Update: Inflation

Review the latest data on inflation in the Houston area. 

Monthly Update: Employment

Review the latest data on jobs in the Houston region. 

Monthly Update: Purchasing Managers Index

Review the latest data on this key economic indicator. 

Get more in-depth analysis from the Partnership team with a Membership.
Executive Partners