Economy at a Glance - June 2022


Back In the Winner's Circle
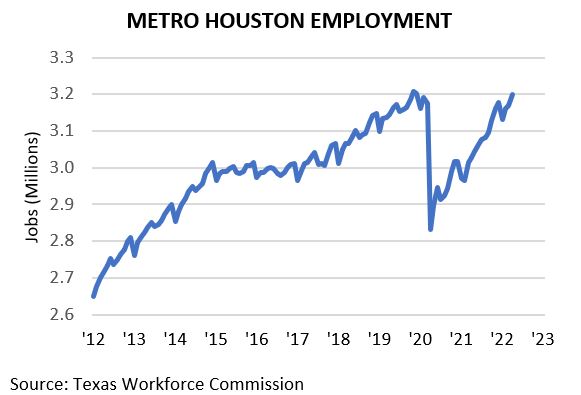
Houston employment has finally returned to pre-pandemic levels. Hitting that milestone elevates the region to an elite status. Of the nation’s twenty most populous metros, only seven have recovered all their pandemic job losses. Houston is one of the seven.
The region’s recovery has been uneven, though. Employment in some sectors is well ahead of where it stood prior to the pandemic. Other sectors are close to full recovery. A few have made little progress.
Economic growth remains strong. At 57.3, the Houston Purchasing Managers Index signals continued expansion. Sales tax collections continue to grow at a double-digit pace. Container traffic at the Port of Houston should set another record this year. Construction activity is well above pre-pandemic levels.
If the current pace of growth holds, Houston could create over 100,000 jobs this year, well above the Partnership’s original forecast of 75,500. But if growth stalls, and that’s possible if the U.S. slips into recession, job growth will be subpar. Other factors could also slow local job growth: inflation, rising interest rates, fallout from the Russia-Ukraine War, a collapse in consumer confidence, and a softening of local housing demand.
Metro Houston added 159,700 jobs in ’21, the best year on record. The region finished the year 15,200 jobs shy of its February 20/pre-COVID level. After seasonal job losses in January, hiring surged. The region added 68,400 jobs February through April, the best start to the year on record, even better than ’12, ’13 and ’14, the heyday of the fracking boom. As of April, non-farm payroll employment stood at 3,198,300, or 6,100 jobs above February ’20 levels.
Half a dozen factors have driven the recovery:
• Robust U.S. Growth: U.S. gross domestic product (GDP) is $528 bil¬lion larger today (adjusted for inflation) than prior to the pandemic.
• Inventory Rebuilding: Wholesalers’ sales were 73.3 per¬cent higher in March ’22 (latest data available) than in April ’20.
• Record Exports: Houston firms shipped $140.8 bil¬lion in products overseas last year, up 9.3 per¬cent from the previous record ($128.7 billion) set in ’19.
• Emergence as a Logistics Center: Developers have ad-ded over 100 million square feet of warehouse space since ’16. The Port of Houston handled a million more shipping containers in ’21 than it did in ’16. Warehousing and transportation was the first sector to fully recover all jobs lost in the pandemic.
• Population Growth: Nearly 32,000 people moved to Houston between July 1, 2020 and June 30, 2021. The region ranked fifth in net in-migration over the period.
• Pent-Up Demand: Nationwide, retail sales have surged 47.7 percent (adjusted for inflation) since April ’20, the lowest point of the COVID-induced recession.
An Uneven Recovery
Some industries have fared better than others. Nine of the 18 major sectors tracked by the Texas Workforce Commission (TWC) have recovered all jobs lost in the pandemic, two have recouped over 90 percent, four just over 50 percent of their losses, and three still struggle to add jobs.
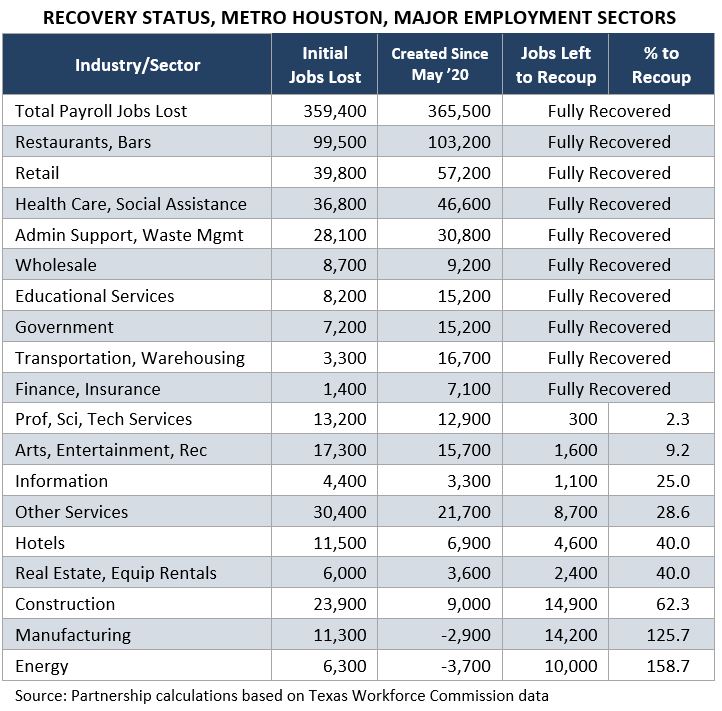
As noted in previous issues of Glance, energy, manu-facturing, and construction delayed Houston’s recovery. Lack of access to capital, pressure to shift investments to low-carbon energy sources, and supply chain snafus have stifled the energy sector’s recovery. Manufacturing won’t recover until upstream energy recovers. Over 80 percent of the sector’s job losses are in oil field equipment manufacturing and fabricated metal products (i.e., pipes, valves, flanges, and structural steel).
The slow recovery in construction is a puzzle, however. According to Dodge Data & Analytics, construction actvity
is up $1.8 billion (19.4 percent) in metro Houston through April of this year compared to the the same period in ’21 and $2.7 billion (32.2 percent) over ’20. Yet employment still lags.
There’s a national shortage of workers across all sectors, but the gap appears to be most acute in construction. “Contractors are eager to hire, but the pool of experienced jobseekers barely exists,” notes Ken Simonson with Associated General Contractors of America. In April, there were 449,000 unfiled construction jobs in the U.S., according to the U.S. Bureau of Labor Statistics. That’s more than double the 208,00 openings in April ’20.
An Exclusive Club
Dallas/Fort Worth was the first of the major U.S. metros to recoup all jobs lost in pandemic, hitting that mark in July ’21. Atlanta, Phoenix, Riverside and Tampa followed in October ’21, then Denver in November ’21. Houston joined the club in April ’22. Other metros may join later, but gains have stagnated for Los Angeles, Minneapolis, New York, San Francisco and Washington, DC.
Those metros have several characteristics in common: high costs of living (see story page 4), high tax burdens, key industries conducive to remote work, image problems, elevated levels of crime, and significant population losses. The latter may be a question of chicken or the egg. Has job growth stagnated in those metros because of population loss, or have those metros lost population because of weak job growth? The answer is likely a combination of both.
Labor Shortage
Employers had over 11.4 million job openings in April. That’s up from an average of 6.4 million in the five years prior to the pandemic. More than one-third (35 percent) of respondents to an April survey by the National Association for Business Economics expect labor shortages at their firms to continue into ’23. Only 11 percent expect any relief this year. In its April survey, the National Federation of Independent Businesses (NFIB) found that 47 percent of its members reported job openings that could not be filled. The lack of available workers, not a weakening economy, may be what holds back future job growth.
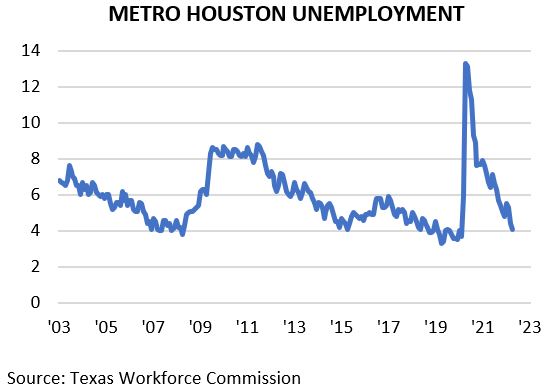
In April, Houston’s unemployment rate was 4.1 percent. Any rate below 5.0 percet suggest a tight labor market. Initial claims for unemployment insurance have fallen below pre-pandemic levels, so fewer Houstonians are being thrown back into the market and forced to look for work.
In preparing its ’22 employment forecast, the Partnership expected half a dozen factors to drive local job growth: a strong U.S. economy, a healthy volume of global trade, energy consumption returning to pre-crisis levels, pent-up consumer demand, local population growth, and the ongoing housing boom. Those assumptions remain valid.
The Partnership also noted the headwinds: ele¬vated infla¬tion, supply chain woes, and worker shortages. What the Partnership didn’t foresee was Russia’s invasion of Ukraine, the Federal Reserve dramatically increasing interest rates, and China contin¬uing to lock down large swaths of its economy to contain outbreaks of the coronavirus.
While the U.S. is unlikely to slip into recession this year (see GHP’s April 6 webinar), the nation will experience slower growth, which is what the Fed is trying to achieve. And the recent slip in consumer confidence is worrisome. But local job growth should remain strong through the end of the year.
Take The Good With The Bad
Over the past few months, the U.S. Census Bureau has released population estimates for all U.S. cities, counties, and metro areas. The data shows that in some ways Hou¬ston has bucked national trends. In others, Houston has followed along.
The nine-county Houston-The Woodlands-Sugar Land Metro Area added 69,000 residents last year. That bucked a national trend. Of the nation’s 384 metros, less than 40 percent added population.
Harris County, the most populous county in the metro Houston area, lost 4,400 residents. That follows a national trend. Of the nation’s 3,143 counties and parishes, close to 42 percent lost population.
The City of Houston, the nation’s fourth most populous city, lost 11,777 residents in ’21. That follows a national trend. Of the nation’s 250 most populous cities, 56.0 percent lost population last year. For the nation’s largest cities, the losses were staggering, with New York, Los Angeles and Chicago suffering a combined exodus of nearly 400,000 residents.
To continue reading, download this report.
Note: The geographic area referred to in this publication as “Houston,” "Houston Area” and “Metro Houston” is the nine-county Census designated metropolitan statistical area of Houston-The Woodlands-Sugar Land, TX. The nine counties are: Austin, Brazoria, Chambers, Fort Bend, Galveston, Harris, Liberty, Montgomery and Waller.