Economy at a Glance - July 2022


The Dream of Home Ownership
For decades, metro Houston has enjoyed an abundance of affordable housing. The region’s home prices have consistently tracked below those of most other metros, drawing individuals, families, and employers to the region.
But housing costs have surged recently. The median price for a single-family home in Houston topped $350,000 in May. Two years ago, the same home would have sold for under $250,000. Interest rates have doubled over the past 18 months. The jump in rates has added nearly $500 to the monthly payment on a $350,000 home. Higher home prices have led to higher residential appraisals and larger property tax bills. A Houston homeowner who’s seen a $100,000 jump in appraised value over the past two years has also seen a bump of $2,000 or more in property taxes.
Though the demand for housing has begun to soften, prices continue to climb. Signs of a slowing economy are everywhere, yet interest rates are still on the rise. Incomes haven’t kept up with price and interest rates hikes, and buyers are finding it more difficult to qualify for a mortgage. And without legislative relief, homeowners will be paying more in property taxes for years to come. Clearly, Houston housing is not as affordable as it once was.
An Historic Perspective
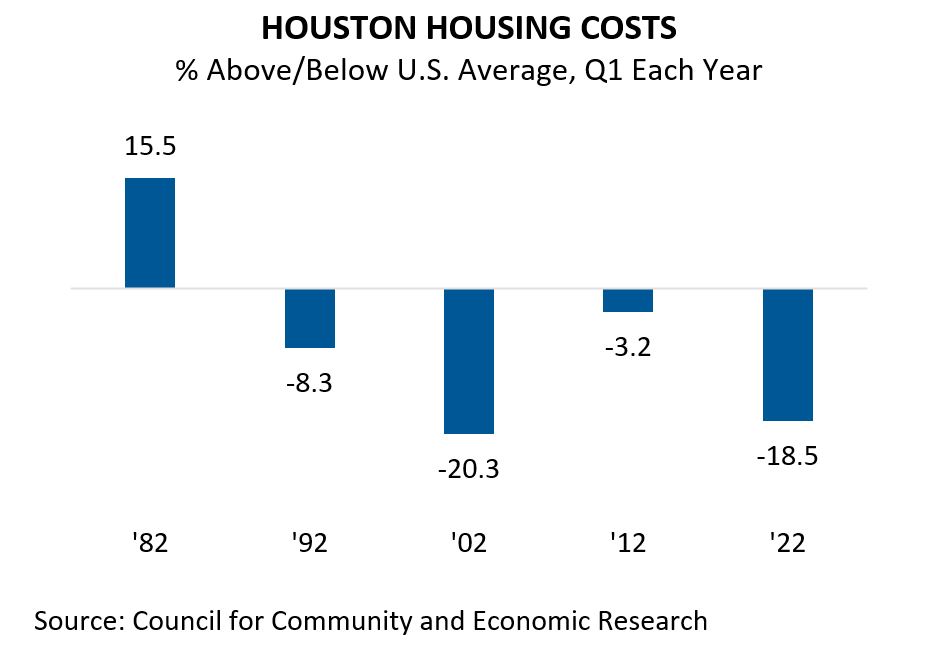
For over 50 years, the Council for Community and Economic Research (C2ER) has published a Cost-of-Living Index. The index measures differences in living costs across the U.S. To compile the index, C2ER gathers data on grocery prices, utility rates, health care expenses, housing costs and various services. According to the index, Houston’s overall living costs were 8.3 percent below the U.S. average in Q1/22. Housing costs were 20 percent below.
Houston’s housing costs have tracked below the U.S. average for well over 40 years. The exception was the early ‘80s when Houston boomed while the rest of the nation endured back-to-back recessions. Jobseekers flocked to Houston and developers ramped up production to meet the surge in housing demand. In ’82, builders broke ground on over 32,000 single-family homes, a record at the time. This year, builders will start on roughly 40,000 homes, but that’s for a population and workforce that’s more than doubled in size since the ’80s.
In early ’82, oil prices collapsed, massive layoffs followed and the local housing market collapsed. Foreclosures soon outpaced starts. Houston reclaimed its crown for having some of the most affordable housing in the nation. Even during the Fracking Boom when the region added 90,000 to 100,000 jobs each year, Houston’s housing costs tracked below the national average.
Calculating Affordability
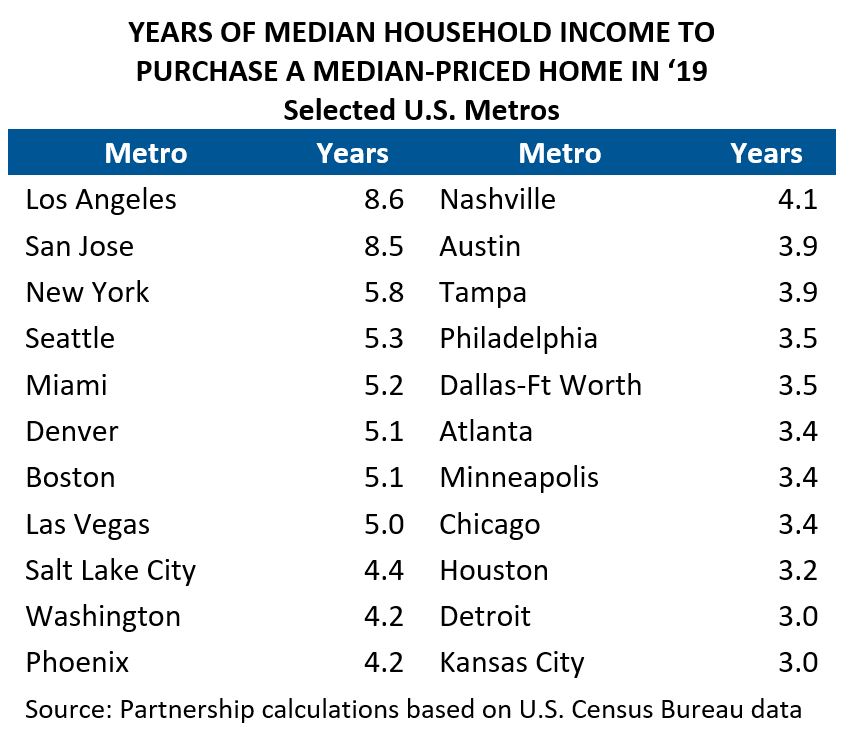
Low prices alone don’t translate into affordable housing. Income needs to be factored in as well. Specifically, the analysis should consider the ratio of home prices to household income in a metro area. The higher the ratio, the less affordable the housing market.

As can be seen in the accompanying table, Houston fares well against most other metros. For instance, Los Angeles, a notoriously expensive housing market, required 8.6 years of median household income to purchase the median-priced home in ’19, the latest year for which income data is available. In Phoenix, a more moderately priced market, it took 4.2 years. In Houston, it took 3.2 years.
Several factors have kept Houston’s housing affordable: an abundance of cheap land, reasonable labor and material costs, the use of municipal utility districts (MUDs) to install infrastructure, and limited restrictions on land use. A white paper published in ’02 by the University of Pennsylvania’s The Wharton School documents how strict land use controls lead to higher housing in many parts of the nation.
The ratio, however, doesn’t account for the tax burden of homeownership. In Texas, property taxes can add significantly to the cost of housing. A nationwide study published by The Tax Foundation found that most counties in the metro Houston area ranked in the upper-most quintile for per capita tax collections. Counties in the Dallas-Fort Worth and Austin areas ranked in the upper quintile as well.
Changing Economics
The economics of home-ownership in Houston began to shift in the early ’10s. The cost of labor and materials rose. Land suitable for development became more expensive. And developers faced new regulatory hurdles after Hurricane Harvey. All the while, an influx of new residents into the region, 1.1 million between ’10 and ’19, demanded more housing.
The law of supply and demand kicked in and home prices began to rise faster than household incomes. From ’10 to ’19, the median price for a home sold through the Houston Association of Realtors’ (HAR) jumped from $153,000 to $259,000, a 69.3 percent increase. The annual median household income for the region rose only $15,250, a 28.3 percent increase, over the same period.
This shift has accelerated recently. The median price of a home sold through the Houston Association of Realtors (HAR) has jumped $101,274 (40.6 percent) since May ’20. Current data on household income is not available, but the Partnership estimates that incomes have grown less than 15 percent over the same period.
We’re Not Alone
Home prices have escalated across the nation. On average, they rose 18.7 percent from Q1/21 to Q1/22, according to the Federal Housing Finance Administration (FHFA). Houston’s 14.3 percent jump ranks 75th among the 100 metros studied. This is one instance when it’s good for Houston to rank near the bottom of a list, but that’s small comfort for buyers watching prices climb and their opportunity to own a home evaporate.
To continue reading, download this report.
Note: The geographic area referred to in this publication as “Houston,” "Houston Area” and “Metro Houston” is the nine-county Census designated metropolitan statistical area of Houston-The Woodlands-Sugar Land, TX. The nine counties are: Austin, Brazoria, Chambers, Fort Bend, Galveston, Harris, Liberty, Montgomery and Waller.