Economy at a Glance - Jan 2021


Houston: The Economy at a Glance is a free monthly publication, which offers the latest data along with expert commentary on the Houston region’s economy. Below is an excerpt from the report.
CHANGES OVER TIME
Every fall, the U.S. Census Bureau releases its American Community Survey (ACS), the bureau’s annual snapshot of social, economic, and demographic characteristics for the nation.
The results of the ’19 ACS were overlooked when released last September, however. The COVID pandemic and the upcoming Presidential elections had grabbed our attention instead.
This issue of Glance corrects that oversight. Using data from the ’10 and ’19 surveys, Glance explores shifts in Houston’s population over time, how Houston compares to other U.S. metros today, and discusses some of the disparities within our region.
There’s one caveat. The ’19 ACS reflects conditions during the final year of the longest economic expansion in U.S. history. Houston, though not booming, was doing relatively well. Data gathered during the pandemic will tell a different story, but it won’t be released until this fall. We must wait another nine months for the ACS to show us how severely the Coronavirus impacted our population. In the meantime, what follows is the Partnership’s analysis of Houston’s social, economic and demographic characteristics in the waning days of the longest U.S. expansion on record.
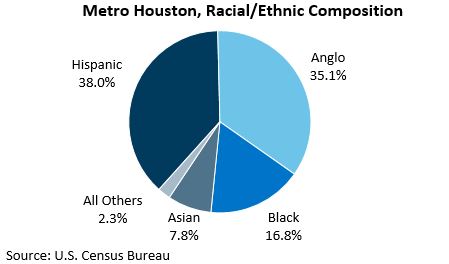
Population, Race And Ethnicity
Houston added nearly 1.1 million residents from the start of the decade to the middle of ’19. The bulk of the growth came from the Hispanic community (582,000 residents), followed by Blacks (191,000), Asians (166,000), and Anglos (120,000).
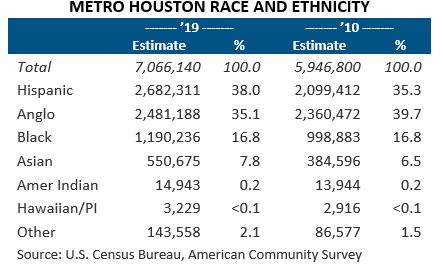
Houston’s Hispanic population surpassed the Anglo population in ’17 and now represents our largest ethnic group. No race or ethnicity comprises a majority of the population, however. It’s been that way since the late ‘90s and is likely to remain that way for at least the next 30 years.
Asians were the fastest growing racial/ethnic group in the decade, their population up 43.2 percent, followed by Hispanics (27.8 percent), Blacks (19.1 percent), and Anglos (5.1 percent).
Houston has one of the most diverse and racially balanced populations of the nation’s major metros. Among the nation’s 50 most populous metros, Houston has the fourth largest Hispanic, eighth largest Black, ninth largest Asian and twelfth largest Anglo communities.
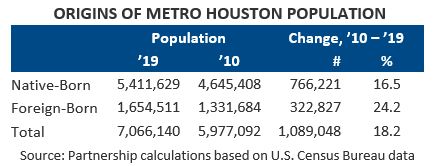
Foreign-Born
Houston ranks fifth in foreign-born population, behind metro New York, Los Angeles, Miami and Chicago. Over two-thirds (68.2 percent) of Houston’s Asian population, one-third (37.2 percent) of our Hispanic population, 10.0 percent of our Black population and 5.6 percent of the Anglo population was born outside the U.S. The share of foreign-born Houstonians has grown up from 22.3 percent in ’10 to 23.4 percent in ’19. The average for the nation’s 50 most populous metros is 14.5 percent.
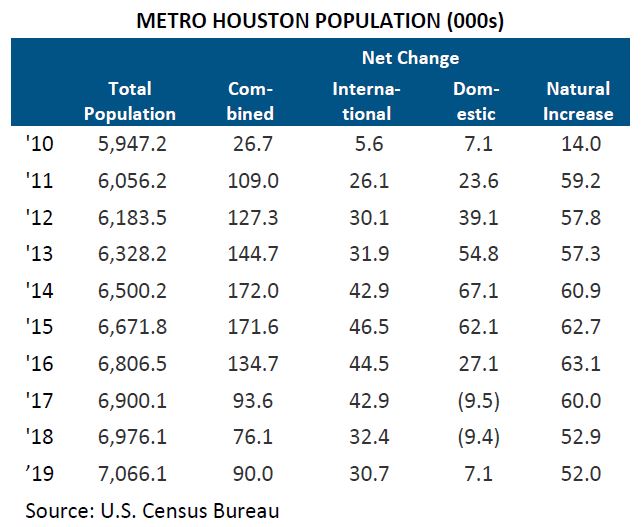
International in-migration has been key to Houston’s growth in recent years. Early in the decade, when our economy boomed, domestic in-migration added 50,000 or more residents per year. But the fracking bust, Hurricane Harvey, and a weak job market now keeps people away. Metro Houston’s domestic in-migration has been negative for two of the last three years (’17 and ’18) and negative for Harris County the last four (’16, ’17, ’18 and ’19). International in-migration, however, has dipped slightly.
Age
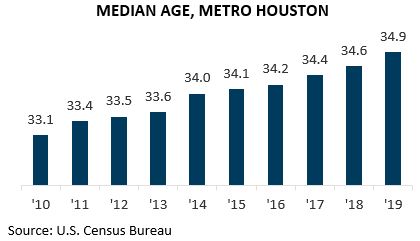
Metro Houston has one of the youngest populations in the nation. The region’s median age is 34.9, compared to 38.5 for the U.S. overall. The average for the 50 most populous metros is 38.1. Houston is second only to Salt Lake City (33.2) in median age. (Note: the median is the point at which half of the population falls below that age and half above it.)
During the past decade, Houston’s population has also grown older. In ’10, the region’s median age was nearly two years younger than it is today.
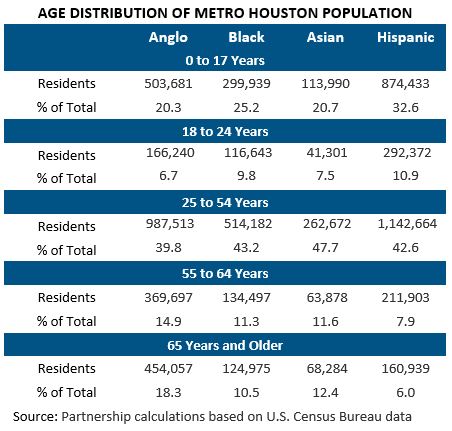
The increase reflects an expanding population of older residents which pulls the median age upward. “Seniors” (residents over 65) now account for 11.5 percent of Houston’s population, up from 8.6 percent in ’10. “Minors” (residents under 18) are now 26.3 percent of the region’s population, down from 27.9 percent in ’06. This older population tends to be Anglo, the younger population Hispanic or Black. For Hispanics, the median age is 28.1 years; for Blacks, 32.9; for Asians, 36.4; for Anglos, 41.9.
Also, one-third of Houston’s Hispanic population and one-fourth of the Black population is under 18, compared to one-fifth of the Anglo population. As a result, Houstonians entering the workforce over the next 10-20 years will represent a more diverse population than in the past.
Note: The geographic area referred to in this publication as “Houston,” "Houston Area” and “Metro Houston” is the nine-county Census designated metropolitan statistical area of Houston-The Woodlands-Sugar Land, TX. The nine counties are: Austin, Brazoria, Chambers, Fort Bend, Galveston, Harris, Liberty, Montgomery and Waller.
To continue reading, please download the full report.