Economy at a Glance - August 2020


Houston: The Economy at a Glance is a free monthly publication, which offers the latest data along with expert commentary on the Houston region’s economy. Below is an excerpt from the report.
The Perennial Questions
“How much of Houston’s economy is tied to energy?”
That question gets asked every time the price of crude drops by more than a few dollars.
“Is Houston less dependent on energy than it was 10, 20 or 30 years ago?”
That gets asked by residents who lived through previous downturns and worry that Houston remains as vulnerable today as it was then.
This issue of Glance answers both questions.
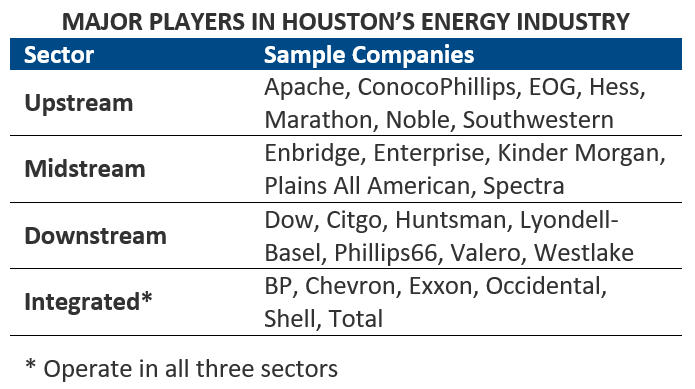
Before answering either question, one must first define the industry. Oil and gas has three sectors: upstream, midstream, and downstream. Upstream includes exploration, production, and oilfield services. Midstream focuses on the processing, transportation, and storage of crude and natural gas. Downstream involves the refining and processing of oil and natural gas into fuels, chemicals, and plastics. All three sectors are well-represented in Houston.
Each sector responds differently to changes in price. Exploration companies ramp up drilling as crude prices rise and ratchet it down as prices fall. Pipeline profits are tied to the volume of products moving through their systems. Prices are a secondary concern. Refiners prefer low oil prices because they translate into cheaper feedstocks and wider profit margins. Domestic chemical producers prefer low natural gas prices. Their primary feedstocks are natural gas liquids (NGLs), like ethane and propane. Overseas, the primary feedstock is naphtha, which is derived from crude. As oil prices rise and natural gas prices stay flat, U.S. chemical producers have a cost advantage over their foreign competitors. All three sectors are currently dealing with low commodity prices, excess inventories, declines in drilling, government permitting hurdles, and weak overall demand due to the pandemic.
Contribution to Houston's GDP By Industry
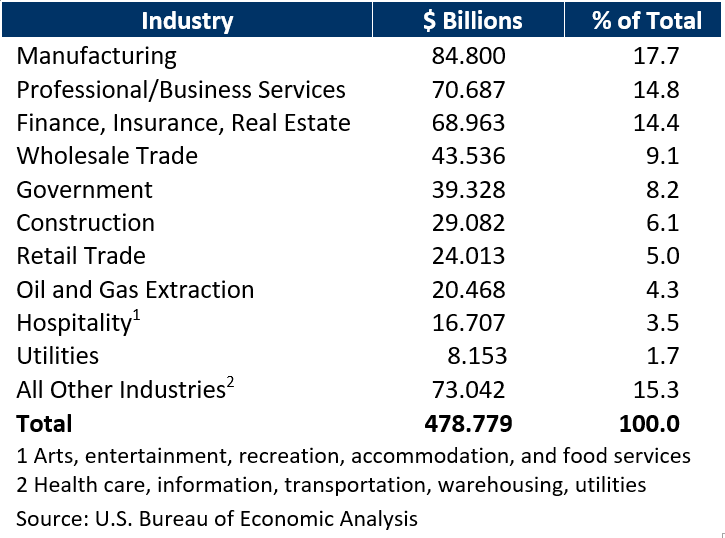

The Bureau of Economic Analysis (BEA) estimates that oil and gas extraction accounted for $20.5 billion (4.3 percent) of Houston’s GDP in ’18. That’s down from $33.1 billion or 7.7 percent in ’14.
Changes in BEA's GDP Estimates
BEA no longer publishes estimates of chemicals, refining, and pipelines contributions to Houston GDP. The last year for which the data was available (’14), upstream, midstream and downstream accounted for 26.8 percent. Factor in oilfield equipment and fabricated metal products manufacturing and energy’s share of Houston GDP jumped to 30 percent.
Much has happened since then, however. Oil prices have collapsed, upstream employment has tumbled, operators have added 30,000 miles of pipelines to their systems, and chemical companies have invested over $60 billion in new plants and facilities. As a result, previous estimates of energy’s contribution to GDP are no longer valid.
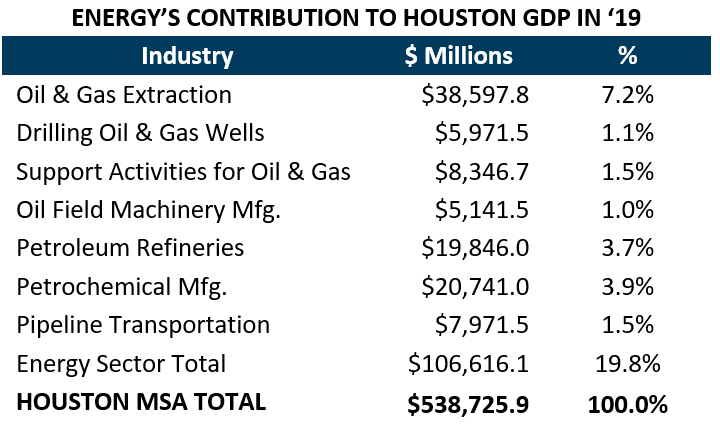
Partnership Estimates
Assuming that chemicals and refined products account for over 90 percent of nondurables manufacturing, the Partnership estimates that downstream energy contributed about $52.0 billion, or 10.8 percent, to metro GDP in ’18. That’s two and half times upstream’s share, which BEA estimates at $20.5 billion, or 4.3 percent of GDP. Add together upstream and downstream, assume that pipelines, equipment manufacturing, engineering and a handful of other sectors contributed another $20 billion, and energy likely accounted for around 25 percent of GDP in ’18. That’s down from 30 percent in ’14.
Continue reading this month's Economy at a Glance for more insight into the COVID-19 pandemic and unemployment in the Houston region. To subscribe to Glance, please click here.