Economy at a Glance - April 2023


Population Growth Surges
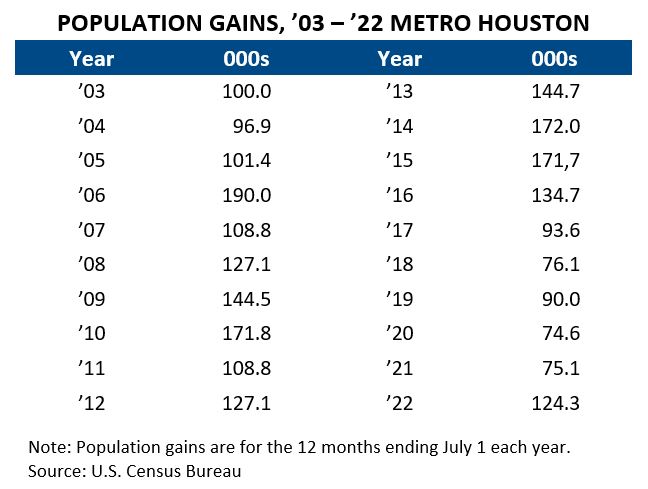
Metro Houston added nearly 125,000 residents in ’22, ranking second among the nation’s major metros in population growth, according to the Partnership’s analysis of U.S. Census Bureau data. That’s up from ’21 when the lingering effects of COVID limited the region’s gains to just over 75,000. ’21 was the second weakest year for population growth of the past 20 years while ’22 was slightly above the long-term average of 119,000 per year.
The surge in population helps to explain last year’s robust job growth, strong demand for housing, and increased congestion on the region’s roads and freeways. Houston added 176,000 jobs, closed on 108,000 single-family homes, absorbed 21,000 apartment units, and delivered 280,000 new vehicles over period covered by the Census data, i.e., the 12 months ending July 1, 2022.
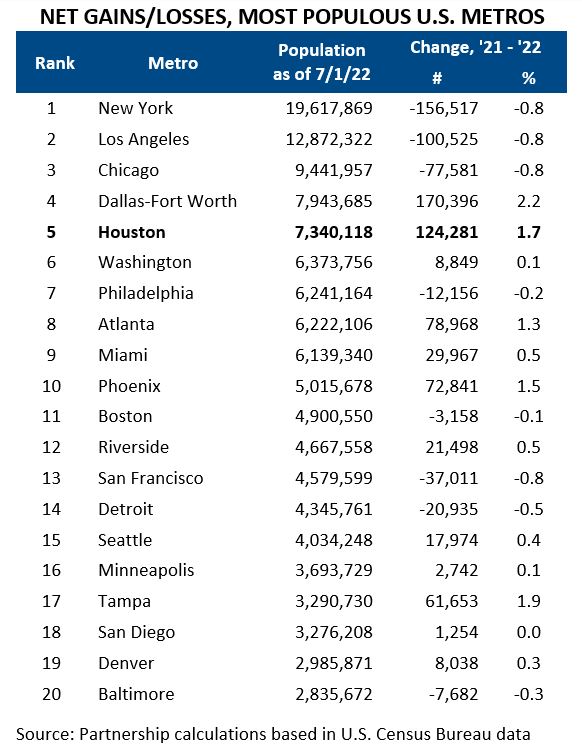
Houston performed exceptionally well last year considering nine of the nation’s 20 largest metros shed population and five added fewer than 20,000 residents. At cur-rent growth rates, the rankings of the 10 most populous metros are unlikely to shift anytime soon. Houston has a lock on fifth place, is unlikely to catch Dallas-Fort Worth, and is in little danger of losing ground to Washington, DC.
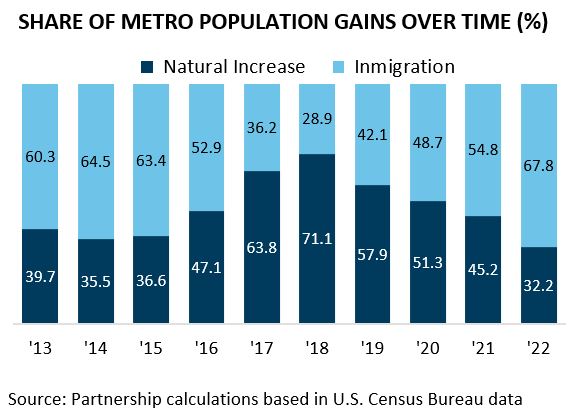
A common misconception is that Houston’s #2 ranking represents 125,000 residents moving to the region. The gains came from two sources: the natural rate of increase and net inmigration. The natural increase reflects the number of births minus deaths in the region. Net inmigration reflects the number of people who moved into Houston minus those who moved out.
Two-thirds of Houston’s population gains in ’22 came from net inmigration, one-third from the natural increase. The ratio frequently shifts, with inmigration accounting for a larger share of population growth when the region’s economy booms and a smaller share when it struggles.
Net Inmigration
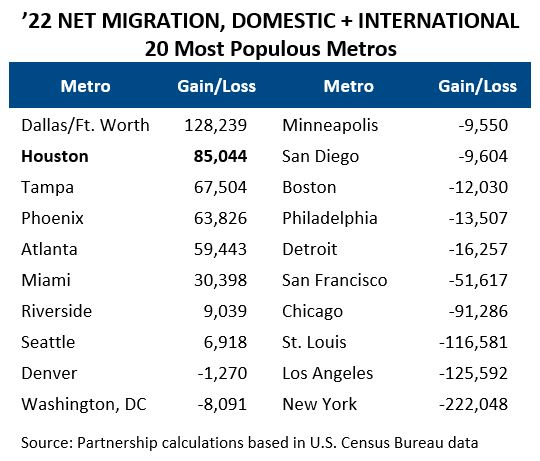
Metro Houston ranked second in net inmigration in ’22. Twelve of the nation’s 20 largest metros had negative in-migration, i.e., more residents moved out than moved into those regions. Chicago, Los Angeles, New York, San Francisco, and St. Louis lost a combined 600,000 residents to outmigration last year. If not for births exceeding deaths in these metros, their overall population losses would have been even greater.
Net migration has two components, domestic and international. Domestic reflects the population moving from within the United States while international reflects the population relocating from abroad. International migration includes ex-pat workers called home from overseas, foreign workers assigned to multinational companies in Houston, military personnel redeployed stateside, international students enrolling at local universities, temporary workers on H1-B and H2-B visas, refugees placed in the city by relief agencies, and immigrants (documented and undocumented) who left their homelands for better lives in America.
Houston ranked third in the nation for international migration last year, behind New York and Miami. All 20 of the nation’s most populous metros benefitted from international migration.
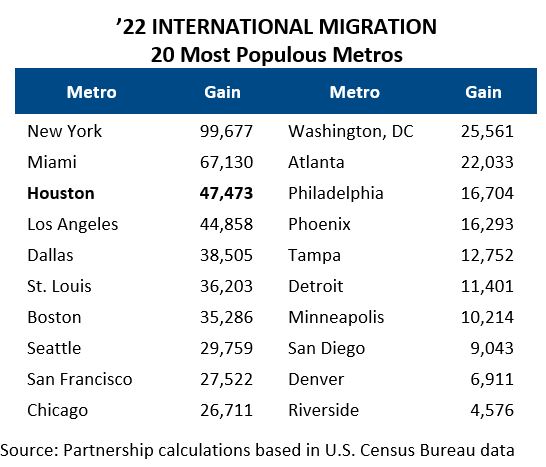
International migration accounted for over half (55.8 percent) of Houston’s net migration last year and well over one-third (38.2 percent) of the region’s overall gains. The flow of foreign-born residents and workers into the region remains essential for the region’s growth.
According to the Census 2021 American Community Survey (the latest detailed demographics available):
- 24.1 percent of the metro Houston population is foreign-born.
- 30.7 percent of the metro workforce was born outside the U.S.
- Unemployment for Houston’s foreign-born averaged 4.3 percent in ’21 vs. 5.1 percent for the native-born.
- A ’19 study by the Partnership found the output of foreign-born workers accounted for 30.8 percent of the region’s gross domestic product.
To continue reading, download this report.
Note: The geographic area referred to in this publication as “Houston,” "Houston Area” and “Metro Houston” is the nine-county Census designated metropolitan statistical area of Houston-The Woodlands-Sugar Land, TX. The nine counties are: Austin, Brazoria, Chambers, Fort Bend, Galveston, Harris, Liberty, Montgomery and Waller.