The Partnership sends updates for the most important economic indicators each month. If you would like to opt-in to receive these updates, please click here.
Estimated Reading Time: 2 minutes.
The Houston office market recorded positive 395,994 square feet of net absorption in Q2/26, returning to the positive momentum observed throughout ’25 despite a negative net absorption in Q1/26. This marks a return to expansion, with positive net absorption recorded in four of the past five quarters. So far in ’26, the market has posted 257,007 square feet of positive net absorption, a much smaller number than approximately 1.3 million square feet in positive net absorption for the first two quarters of ’25. Absorption trends have remained volatile, with periods of expansion often followed by renewed contraction. Houston has recorded negative absorption in three of the past five years and six of the last ten, indicating that periods of space contraction have continued to outweigh expansion over time.
Since Q2/16, quarterly net absorption has averaged negative 100,946 square feet, highlighting the structural challenges the Houston office market has faced in sustaining consistent demand. The availability rate, which includes vacant, soon-to-be-vacant, and sublease space, peaked at 28.7 percent in Q3/23 before easing to 26.6 percent in Q2/26. Prolonged periods of contraction over the past decade have contributed to the elevated level of available space that remains in the market.
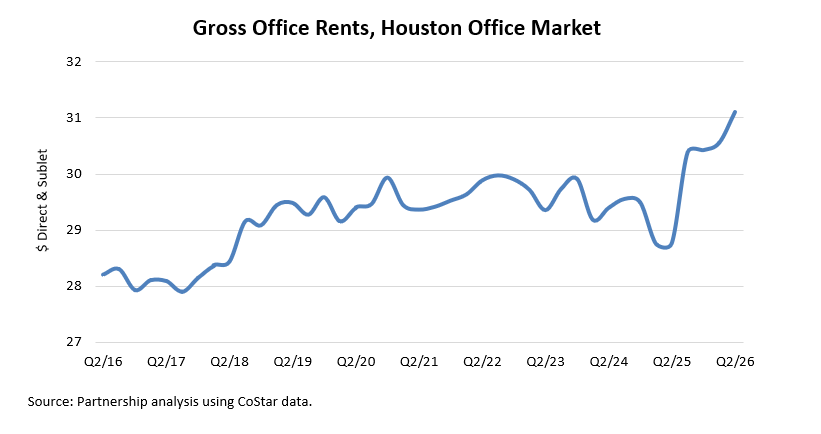
At the same time, the Houston office market recorded a continued increase in asking rents. Average gross rents rose to $31.10 per square foot in Q2/26, up approximately 8.1 percent from $28.76 per square foot in Q2/25, pushing overall asking rents above the $30 threshold. This upward movement reflects landlord confidence in top-tier assets and the ongoing flight-to-quality trend, though part of the increase also reflects broader inflationary pressures, as tenants remain focused on well-located, higher-quality Class A space.
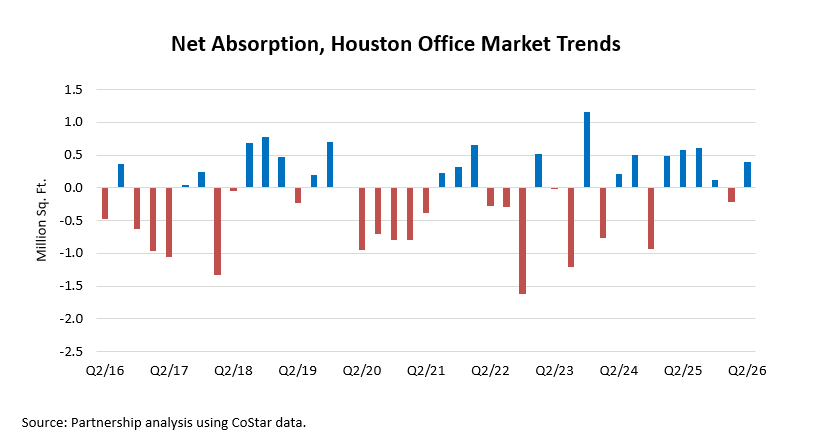
Negative absorption over the past decade has added a substantial amount of space to the Houston office market. By class, available space totals approximately 38.6 million square feet in Class A buildings, 25.9 million square feet in Class B properties, and 1.8 million square feet in Class C assets. Given current availability levels, upcoming lease expirations, and recent absorption trends, the market is likely to face continued challenges in reducing vacancy to healthier levels. While overall availability edged down to 26.6 percent in Q2/26, conditions remain far from pre-’15 norms, when availability rates were below 20 percent. Sustained positive absorption and the emergence of new demand drivers will be necessary to meaningfully reduce vacancy levels over time.
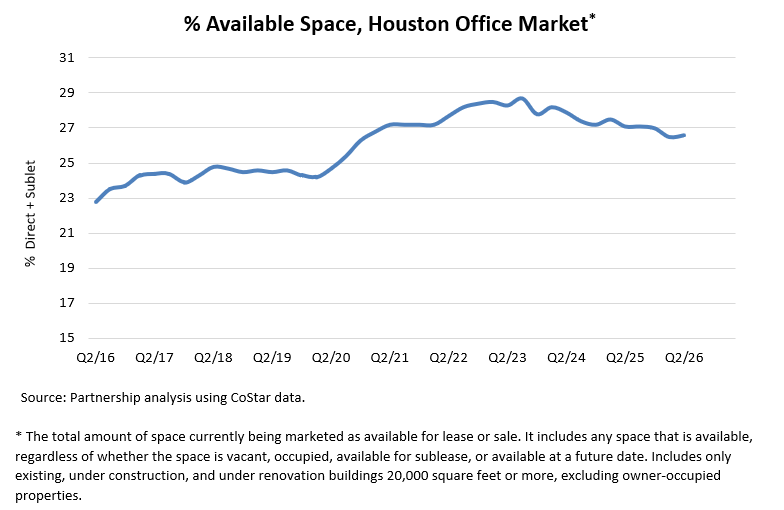
Positive net absorption in Q2/26 has eased pressure on overall market fundamentals, though landlords have maintained some pricing power in higher-quality assets. While nominal rents increased in Q2/26, inflation-adjusted rent growth remains limited, underscoring the market’s ongoing difficulty in achieving meaningful real rent gains despite recent nominal highs.
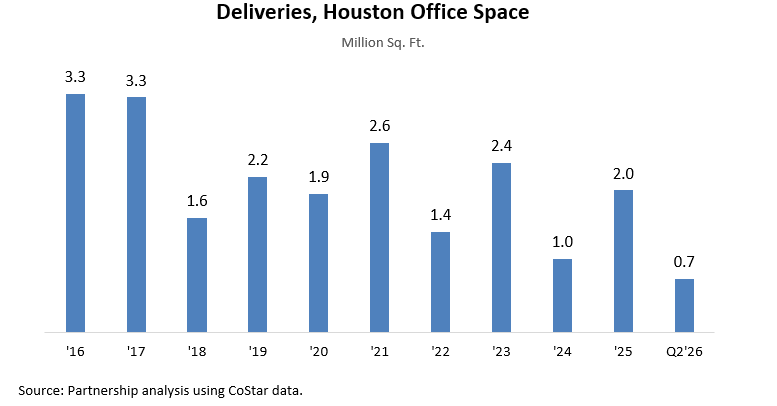
Office construction remains constrained by elevated vacancy and lingering oversupply, resulting in a significantly thinned development pipeline in recent years. Office deliveries totaled approximately 1 million square feet in ’24, followed by 2 million square feet in ’25. As of Q2/26, roughly 572,000 square feet of office space was under construction, representing about 0.2 percent of Houston’s total office inventory of approximately 248.4 million square feet and well below the 10-year average of 1.5 million square feet. Medical office projects accounted for approximately 13 percent of total office construction activity in Q2/26, reflecting continued development in this segment as overall pipeline activity remains subdued.
When leases come up for renewal, tenants are increasingly scaling back space or relocating to newer buildings with enhanced amenities. As of Q2/26, vacancy rates for buildings delivered within the past 15 years (since ‘11) averaged 15.2 percent, compared to 28.0 percent in buildings delivered prior to ‘11, highlighting the continued flight-to-quality trend in Houston’s office market.