


Key August Takeaways
Here are the facts to know about the Houston region this month
August Takeaway #1
Property damage from Hurricane Beryl was a faction of that experienced with Hurricane’s Ike and Harvey.
August Takeaway #2
In Q2/24, 180 businesses made plans to expand or relocate in the region.
August Takeaway #3
Last year, metro Houston gained more Hispanic residents than any other metro.
HURRICANE BERYL
Hurricane Beryl made landfall near Matagorda, Texas as a Category 1 Hurricane around 4 a.m. Monday, July 8. The hurricane’s path took it through parts of Brazoria, Fort Bend, Harris, and Montgomery Counties. These four represent 90 percent of the region’s 7.5 million residents.
Hurricane Beryl was primarily a wind event, with most of the damage caused by fallen trees and downed power lines. Maximum sustained winds were 80 miles per hour (mph). By comparison, maximum sustained winds for Hurricane Ike were 110 mph and for Hurricane Harvey 115 mph. The Texas A&M Forest Service estimates that Hurricane Beryl affected 50 percent of Houston’s urban tree coverage.
Beryl passed through Houston in half a day, unlike Harvey which stalled over Houston and dropped rain for five days. Beryl’s short duration helped limit property damage. Local rainfall was four to eight inches, with 10 to 15 inches in a few isolated spots. Ike dropped six to 10 inches on the region and Harvey 30 to 60 inches.
Power Outages
Beryl knocked out electrical power to nearly 2.3 million CenterPoint customers, about 81 percent of its base. The company lost 20,000 utility poles during the storm. By comparison, 2.2 million customers lost power during Ike. Power outages exceeded 1.7 million statewide for Harvey.
To put Beryl’s 2.3 million outages in perspective, metro Houston had a population of 5.7 million when Ike hit. During Harvey, Houston’s population topped 6.9 million. As of July 1, 2023 (latest data available), the region had 7.5 million residents. Given Houston’s growth over the past 12 months, the region’s population likely topped 7.6 million residents during Beryl.
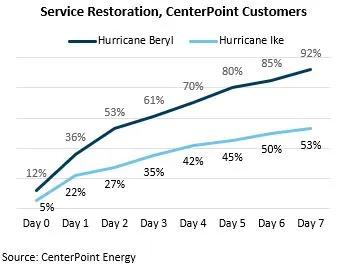
Service Restoration
CenterPoint restored service to 53 percent of its impacted customers within 48 hours and to 92 percent within seven days. By comparison, with Ike 53 percent of CenterPoint’s customers had their power restored within seven days. Comparable numbers for Hurricane Harvey are not readily available.

Property Damage
CoreLogic, a property analytics firm, estimates wind damage claims at $2.5 billion to $3.5 billion due to Beryl. That’s for the entire U.S., not just Houston. Moody’s estimates the losses at $2.5 billion to $4.5 billion, with $3.7 billion as the best estimate. Moody’s estimate includes property damage and business interruption losses. Again, that’s for the entire U.S. By comparison, Hurricane Ike’s losses are estimated at $39 billion and Hurricane Harvey’s at $160 billion, after adjusting for inflation.
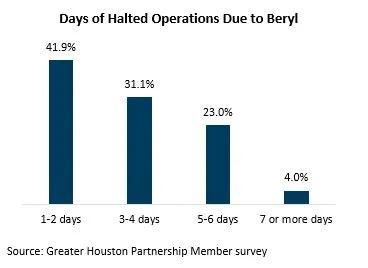
Immediately after the storm, the Greater Houston Partnership asked its members about the impact Hurricane Beryl had on their operations. Eighty members responded to the survey. Most had reopened in four days or less. Only a handful were still closed a week later.
When asked about the specific impacts of the storm:
- 91.3 percent reported they had employees who were unable to report to work,
- 68.8 percent temporarily halted operations,
- 41.3 percent lost sales or revenues,
- 30.0 percent reported damage to their buildings,
- 28.8 percent had delayed shipments or deliveries,
- 21.3 percent suffered equipment damage, and
- 10.0 percent reported inventory losses.
When asked how quickly they returned to normal staffing levels:
- 18.8 percent reported within one to two days,
- 37.5 percent reported within three to five days, and
- 40.0 percent reported within one week.
None of the respondents reported water in their facilities. Only 40 percent reported wind damage. Houston has invested roughly $10 billion in flood mitigation projects since Hurricane Harvey which helped to minimize damage.
The vast majority (91.1 percent) of respondents indicated the storm will have no long-term impact on their ability to conduct business.
Local Infrastructure
Hurricane Beryl disrupted operations at Bush Intercontinental and Hobby Airports, leading to flight cancellations in the late morning and early afternoon. The airports resumed normal operations within four hours of the storm’s passing.
Port Houston reopened 48 hours after the storm. The port extended operating hours and cleared all delayed cargo movements within a week.
Several refineries reduced operations or shut down units ahead of the storm, but these outages were indiscernible from normal seasonal patterns. There was similar feedback from the chemical sector, though some damage to minor units was reported.
Impacts to area rail and trucking centered on power outages at warehouses, but most were restored within a few days. There were no reports of roads or bridges washed out due to the storm.
To continue reading, download this report.
Note: The geographic area referred to in this publication as “Houston,” “Houston Area” and “Metro Houston” is the ten-county Census designated metropolitan statistical area of Houston-Pasadena-The Woodlands-Sugar Land, TX. The ten counties are: Austin, Brazoria, Chambers, Fort Bend, Galveston, Harris, Liberty, Montgomery, San Jacinto, and Waller.
Want to learn more? Contact our Research Team:
Patrick Jankowski, CERP
Senior Vice President, Research
713-844-3616
pjankowski@houston.org