
Data, Insight & Analysis

0
Recent Downloads

Economy at a Glance - May 2024

This month’s issue of Glance examines Houston’s ties to the global economy, the contributions of the non-profit arts community to the regional economy, and the recent slowdown in Houston job growth.
Published on 5/6/24

GLOBAL HOUSTON

The outlook for global growth continues to improve. In April, the International Monetary Fund (IMF) forecast the world’s economy would grow 3.2 percent in ’24, up from 2.9 percent in its October forecast. The World Trade Organization (WTO) expects merchandise trade to grow 3.3 percent this year, up from 0.8 percent last year. Both forecasts bode well for Houston since the region is closely tied to the global economy. For example:
  • More than 12,000 Houston-based companies export goods and services to markets overseas.
  • The Houston/Galveston Customs District routinely handles more foreign tonnage than any other U.S. customs district. 
  • Over 1,700 foreign-owned firms have offices, factories, ware¬houses, or service centers in Houston.
  • 139 Houston-based firms operate over 3,100 subsidiaries in over 100 foreign countries.
  • Over 1.7 million Houston residents, nearly one in every four, were born outside the U.S.
  • 17 foreign banks, 39 foreign chambers of commerce and trade associations, and 15 trade and commercial offices promote trade and in¬vestment in the region.
  • 88 foreign governments have career or honorary consular offices in Houston.

Now, a closer look at Houston’s global trade ties.

Houston Exports

Houston led the nation in exports in ’23, shipping $175.5 billion in goods and commodities abroad. New York ranked second, Chicago third. Houston has ranked as the nation’s top exporting metro in 11 out of the past 12 years. The exception was in ’16 when OPEC flooded the market with crude and oil traded under $50 per barrel most of the year. There wasn’t much demand back then for oil field services and equipment, one of Houston’s major exports.


The data comes from the U.S. Census Bureau’s origin of movement (OM) series, which tracks goods based on the metro from which they began their export journey. For example, a medical device may be manufactured in Houston, then flown to New York where it’s transferred onto a plane destined for Europe. Though the export leaves the U.S. via New York, it began its export journey in Houston. Census considers that as a Houston export. 

According to IMPLAN, an economic model the Partnership uses to measure the benefit of relocations, special events, and new programs on the local economy, goods exports supported over 371,000 jobs (direct, indirect and induced) in Houston in ’22, provided over $49 billion in wages, salaries, and other income, and accounted for $136 billion (19.6 percent) of the region’s $698 billion gross domestic product (GDP). 

Data on the volume of services (engineering, medical, travel, transportation, etc.) that Houston exports is unavailable. However, the International Trade Administration (ITA) estimates that exports support between 0.3 and 11.2 percent of all service jobs in the U.S., depending on the industry. Applying those percentages to local employment by sector suggests another 130,000 Houston jobs depend on service exports. There’s likely double counting in the IMPLAN and the ITA analysis, but even so, the export of goods and services likely supports over 400,000 jobs in the region.

Customs District Traffic

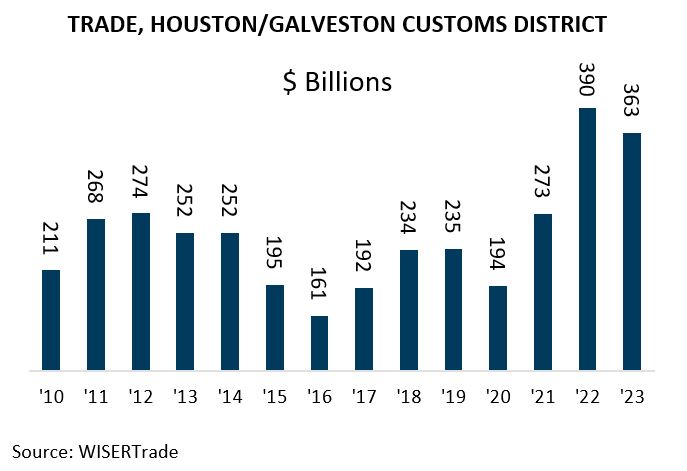
The Houston/Galveston Customs District set a tonnage record in ’23. The eight ports that comprise the district handled over 404.7 million metric tons of goods and commodities, a 6.4 percent rise over ’21. Those shipments were valued at $360.6 billion, down 6.9 percent from ’23.  The dip in value reflects a drop in crude, chemical, and re-fined product prices from the previous year. 

Customs district data differs from the origin of movement (OM) data in that district data reflects what passes through a region, which doesn’t necessarily correspond with where an item was manufactured or produced. However, for Houston, customs district exports align with the region’s industrial base.
 
In ’23, the Houston/Galveston district exported $1.0  billion or more of aircraft parts, aluminum articles, beer, wines and spirits, cereal grains, crude and refined products, electrical machinery industrial machinery, inorganic chemicals, iron and steel, organic chemicals, pharmaceuticals, plastics, rubber, instruments and measuring devices, and vehicles. The region’s imported many of the same items it imported plus apparel, copper, home furnishings, perfumes and essential oils, toys and games, and wood.

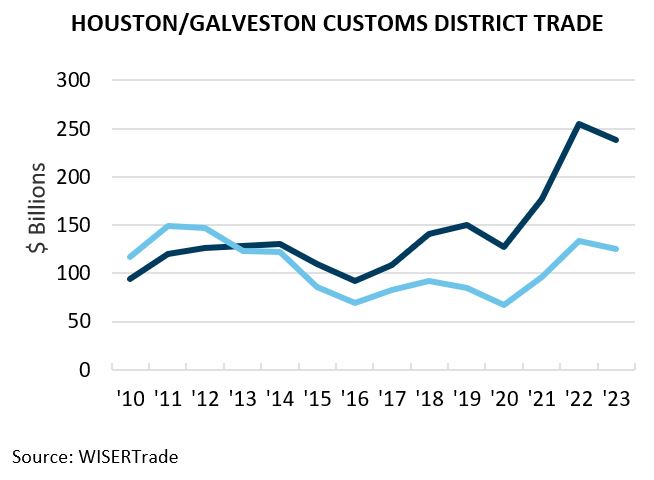
Exports via the Houston/Galveston district consistently exceed imports. They accounted for 66.1 percent of all cargo value handled by the district in ’23. By comparison, exports accounted for 17.9 percent of the Los Angeles district’s exports, 19.7 percent of New York’s, and 28.8 percent of Savannah’s. 

The district exported $1.0 billion or more to 41 countries in ’23. Those countries were Argentina, Australia, Bahamas, Belgium, Brazil, Canada, Chile, China, Colombia, Costa Rica, Denmark, Dominican Republic, Ecuador, France, Germany, Guatemala, Honduras, India, Indonesia, Ireland, Italy, Japan, Malaysia, Mexico, Netherlands, Nigeria, Norway, Panama, Peru, Poland, Saudi Arabia, Singapore, South Africa, South Korea, Spain, Sweden, Taiwan, Thai-land, Turkey, U.A.E., and United Kingdom.

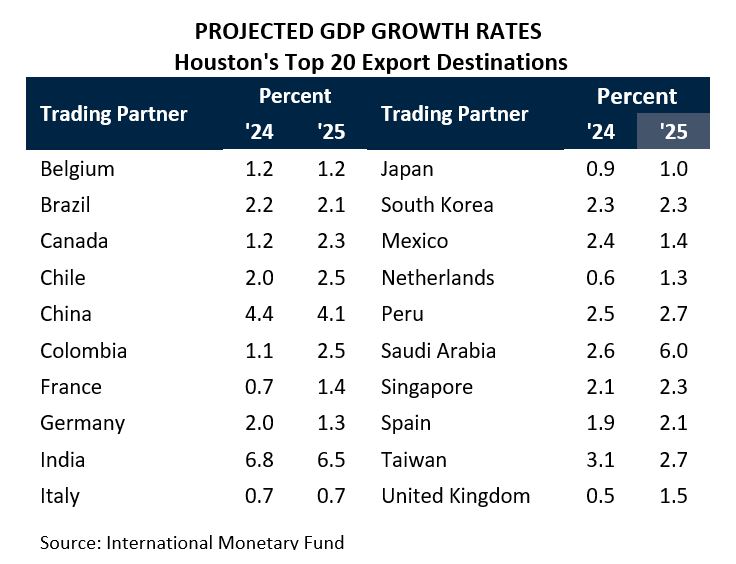
Among Houston’s 20 largest trading partners, which account for 75.0 percent of the region’s trade, the IMF forecasts economic growth to accelerate in 11 countries, to hold steady in three, and to dip marginally in six. None of Houston’s major trading partners are expected to slip into recession this year or next. 

To continue reading, download this report.

Note: The geographic area referred to in this publication as “Houston,” "Houston Area” and “Metro Houston” is the ten-county Census designated metropolitan statistical area of Houston-Pasadena-The Woodlands-Sugar Land, TX. The ten counties are: Austin, Brazoria, Chambers, Fort Bend, Galveston, Harris, Liberty, Montgomery, San Jacinto, and Waller.

Key March Takeaways

Here are the facts to know about the Houston region this month
1
May Takeaway #1
Houston led the nation in exports in ’23, shipping $175.5 billion in goods and commodities overseas.
2
May Takeaway #2
The export of goods and services supports over 400,000 jobs (direct, indirect and induced) in the region.
3
May Takeaway #3
52 foreign-owned companies announced plans to relocate, expand, or start operations in Houston in ’23.

Want to learn more? Contact our Research Team:

Patrick Jankowski, CERP
Senior Vice President, Research
713-844-3616

Previous Issues of Economy at a Glance

APR
2024
Population Gains, Relocations and Expansions, Housing Affordability, and Job Growth
Read Report
MAR
2024
The pandemic’s impact on Houston
Read Report
FEB
2024
Local and U.S. economic trends
Read Report
JAN
2024
Employment Forecast Summary, Houston GDP, and Job Growth
Read Report
DEC
2023
Houston exports, employment, the business climate in Texas, and a peek into Partnership’s forecast for 2024
Read Report
NOV
2023
Houston’s population compared to other major U.S. metros
Read Report
OCT
2023
Shifts in Houston’s Demography
Read Report
SEPT
2023
The Houston Ship Channel, the outlook for business in Texas, and local employment trends
Read Report
AUG
2023
The Pivot from Recession to Resilience
Read Report
JUL
2023
Mid-Year Report
Read Report
JUN
2023
The Global Economy, Home Sales, and Construction
Read Report
MAY
2023
U.S. Economic Outlook and Houston's Energy Industry
Read Report
APR
2023
Houston's population growth and employment revisions
Read Report
MAR
2023
U.S. Recession and Houston's Key Indicators
Read Report
FEB
2023
The Year in Review
Read Report
JAN
2023
The U.S. Economy and Houston's GDP Estimates
Read Report
DEC
2022
Recovery in the Oil and Gas Industry
Read Report
NOV
2022
Metro Houston's Job Growth and the Apartment Market
Read Report
OCT
2022
Exploring Population Changes Through the ACS
Read Report
SEPT
2022
Recession? Maybe, Maybe Not
Read Report
AUG
2022
Houston at Mid-Year
Read Report
JUL
2022
The Houston Housing Market, Affordability, and Recent Shifts
Read Report
JUN
2022
Economic Recovery, Population Growth & Global Houston recap
Read Report
MAY
2022
Economic recovery, rising costs & labor force
Read Report
APR
2022
Population growth and employment data
Read Report
MAR
2022
Local Impact of a Global Event
Read Report
FEB
2022
Post-Analysis of 2021 Houston Economy
Read Report
JAN
2022
Omicron, GDP, Employment
Read Report
DEC
2021
2022 Employment Forecast
Read Report
NOV
2021
Job Gains, Real Estate, Exports
Read Report
OCT
2021
Inflation, Employment & Global Innovation
Read Report
SEP
2021
Employment, Oil & Gas, Containerized Exports, and Housing
Read Report
AUG
2021
Delta Variant, Rebounding Travel, Economic Growth and Population Gains
Read Report
JUL
2021
Energy Transition, Recovery Bottlenecks, & the Worker Shortage
Read Report
JUN
2021
Economic Recovery, Multifamily, Population & More
Read Report
May
2021
Housing Boom and Robust Recovery
Read Report
APR
2021
Pandemic Recovery, Tech Workforce
Read Report
MAR
2021
Pandemic Employment Data
Read Report
FEB
2021
Coronavirus Impact and 2021 Outlook
Read Report
JAN
2021
Racial Demographics and Population Shifts
Read Report
NOV
2020
U.S. Recovery, 2021 Outlook
Read Report
OCT
2020
U.S. Recovery, Houston Update
Read Report
SEP
2020
COVID-19 Impact on Economy
Read Report
AUG
2020
Energy Change Over Time
Read Report
JUL
2020
COVID-19 Update, Houston Unemployment
Read Report
JUN
2020
COVID-19 Update, Affected Sectors, Energy
Read Report
MAY
2020
U.S. & Texas Outlook, GDP
Read Report
APR
2020
COVID-19 Update, PMI, Industry Outlook
Read Report
MAR
2020
Economic Impact, Global Outlook, Recession Probability
Read Report
FEB
2020
U.S.-China Trade Deal, USMCA
Read Report
JAN
2020
Houston GDP, Energy, Jobs
Read Report
DEC
2019
Sector by Sector Forecast for 2020
Read Report
NOV
2019
Houston Region Demographic Update 2
Read Report
OCT
2019
Houston Region Demographic Update 1
Read Report
SEP
2019
Houston's Growth Engines
Read Report
AUG
2019
PMI, Commercial Real Estate & Housing
Read Report

More Insight & Analysis

Monthly Update: Inflation

Review the latest data on inflation in the Houston area. 

Monthly Update: Employment

Review the latest data on jobs in the Houston region. 

Monthly Update: Purchasing Managers Index

Review the latest data on this key economic indicator. 

Get more in-depth analysis from the Partnership team with a Membership.
Executive Partners